Analyze VPIs
MatrixScope

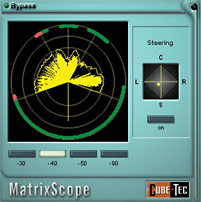
In a two-channel environment the MatrixScope provides a visual display of the side effects one has to consider if the two channels are processed by a matrix surround-decoder.
The signals of all four-output channels of the decoder are displayed corresponding to their direction and in accordance with the standard reference positioning of loudspeakers in a 3/2 stereo setup. Impulses are displayed as a peak-envelope. A second display monitors the dominance between the four channels, which is detected and processed by the decoder.
MatrixScope offers assistance for optimizing the main directivity of surround-coded down-mixes and it is an indispensable tool for verifying the matrix-decoder compatibility after adjusting the stereo panorama of the recording.
The MatrixScope is part of the Cube-Tec Analyzer package, a family of real-time visualizing analysis tools that include: SpectroGraph, PhaseScope and ZoomAnalyzer.
PhaseScope

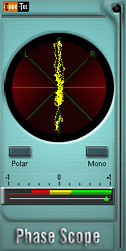
PhaseScope is a phase analysis tool that features a stereo display with an integrated correlation meter. Display of Lissajous figures is executed with a precision and speed previously not available in software goniometers.
PhaseScope allows the user to clearly recognize different stereo recording techniques, as well as levels and stereo panorama positions of various sound sources. In addition to monitoring the current correlation status, PhaseScope displays the correlation development against a short-term time span.
Finally, PhaseScope's mono switch offers additional acoustic control by making the visible phase errors audible in the mono master.
The PhaseScope is part of the Cube-Tec Analyzer package, a family of real-time visualizing analysis tools that include: SpectroGraph, ZoomAnalyzer and MatrixScope.
SpectoGraph

SpectroGraph is a tool to clearly identify disturbances with continuous frequencies in audio signals, such as mains hum, pilot tones in broadcast signals, DC offset, etc.
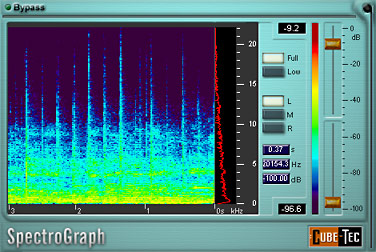
It is very useful in finding frequency characteristics of instruments and harmonics, or to visualize the spectrum of a noise floor. The frequency range from 'zero' to 'half the sampling rate' of the incoming signal is displayed in a spectrogram.
The display consists of sixty four colors with very fine frequency resolution, over a three second period. By moving the mouse over the spectrogram, the frequency, level, and time of this point are shown in three individual displays, providing a visual reference for frequency identification. Two sliders set the range of the levels to be displayed. Signals above and below those levels will not be shown, providing a better focus on the level of the target frequency.
The frequency range can be limited to 1 kHz for a more in depth analysis of the lower frequency range. Left or right channel of stereo material can be viewed, and in stereo mode the sum of the spectra of both channels will be shown, avoiding cancellation effects caused by phase inverted channels.
The SpectroGraph is part of the Cube-Tec Analyzer package, a family of real-time visualizing analysis tools that include: PhaseScope, ZoomAnalyzer and MatrixScope.
ZoomAnalyzer

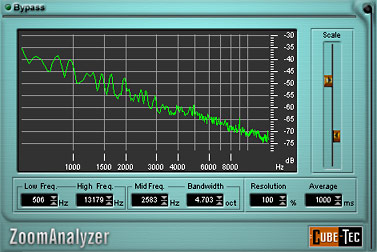
The ZoomAnalyzer adds a new precise spectral analysis tool to the range of AudioCube 'Analysis' VPIs. As its name implies, the ZoomAnalyzer has the ability to zoom into the frequency and level axis of a signal to any desired range.
The viewable bandwidth can be set by editing 'Low' and 'High Frequency', or by selecting 'Mid Frequency' and 'Bandwidth' in octaves. It is possible for instance, to look at the range between 20 and 200 Hz, while simultaneously optimizing the level-axis scale.
'Resolution' offers an exact display of very low frequencies -- it is possible to set the frequency axis to have a viewable bandwidth of 1 cycle! This makes the ZoomAnalyzer a valuable tool for very special applications like forensic work. A 'History' function and the ability to return to the full frequency range with a single mouse click make the ZoomAnalyzer a powerful yet easy to use instrument.
The ZoomAnalyzer is part of the Cube-Tec Analyzer package, a family of real-time visualizing analysis tools that include: SpectroGraph, PhaseScope and MatrixScope.

